Here is a short extract from the latest market commentary by John Chatfeild Roberts, who runs the successful multi-manager team at Jupiter Asset Management.
The start of the New Year is of course a traditional time to take stock of the situation and make resolutions for the coming year. Unfortunately what many investors resolved to do when they got back to their desks in January was “sell, sell, sell”. The early weeks of 2016 have been a difficult time in global stock markets, with the UK market down 5.8%, the US down 6.6% and Europe down 7.4%. [1]
So what changed? Well, in reality very little except perception. Evidence of this can be seen by the market rise triggered by comments from Mario Draghi, president of the European Central Bank, that he may possibly reconsider current monetary policy and provide further stimulus to the eurozone economy. If such comments can trigger sudden price moves it tells you that markets are acting more on feelings than facts.
Is that right? There is another way of making the same point. This chart is from Bank of America Merrill Lynch’s regular survey of global fund manager expectations, which has been running for many years and remains a useful, if sometimes contrarian, indicator of how market sentiment is moving. The chart plots the percentage of fund managers who think we are the early, middle or late stages of the economic cycle (the final option being recession).
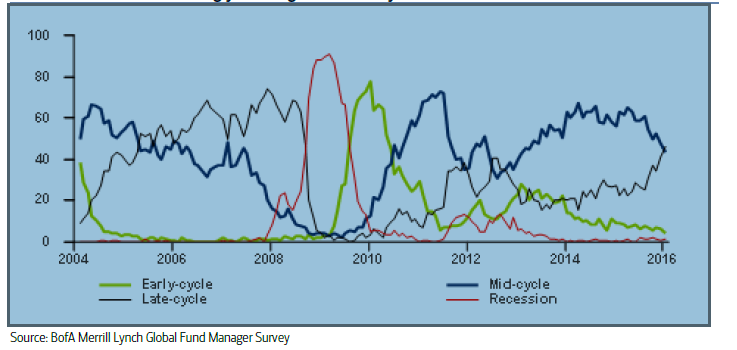
As you can see there has been a significant change in mood over the course of the last year, with the number of those saying we are in the late stages of the cycle poised to overtake those who think that we are still in mid-cycle. I think this goes some way to explaining why professional investors have been so nervous going into the New Year, sparking a wave of selling in the face of several well-documented but as yet not fully materialised risks – China’s slowdown, bankruptcies in the oil and gas sector and fallout from the Federal Reserve’s interest rate rise.
It is worth noting however the three most recent times when the two lines crossed over. Two were in 2011 and 2012, when the ongoing crisis over Greece threatened the collapse of the Eurozone and a new debt meltdown seemed a very real possibility. Expectations promptly reversed themselves as the risk of crisis receded. The third crossover happened in 2005 when although the number of late cycle adherents continued to rise, the bull market still had 18 months or so to run. Which way will the trend go from here?
Experience suggests that it is futile to expect professional investors to predict a new recession until the last minute (and the chart confirms this). But the recent shift in sentiment is consistent with the idea that the later stages of a bull market are often the hardest to navigate, as valuations become expensive by historical standards, but the markets are still going up, often with heightened volatility. Although we certainly cannot rule out further market weakness, we could be entering just such a period today.
Main image © www.istockphoto.com
[printfriendly]