
This is one of my regular round ups on the state of the markets, this time following the Brexit vote, but keeping an eye primarily on the medium to longer term context. It is easy to get sidetracked by the excitement of a new event into losing sight of the important longer term trends. Get the right side of the longer term trends and you can survive any number of short term shocks and setbacks. There is also some value in looking to spot opportunities created by excessive moves.
The charts are from Fuller Treacy Money and reproduced with thanks. They are correct as at midday on 7th July 2016. The lighter line on the main panel in each chart represents the 200-day moving average. The RSI at the bottom of each panel represents a standard 14 day momentum measure (overbought above 70, oversold below 30, in broad terms). Further notes will look at some of the more dramatic individual stock and sector moves and the behaviour of some model portfolios.
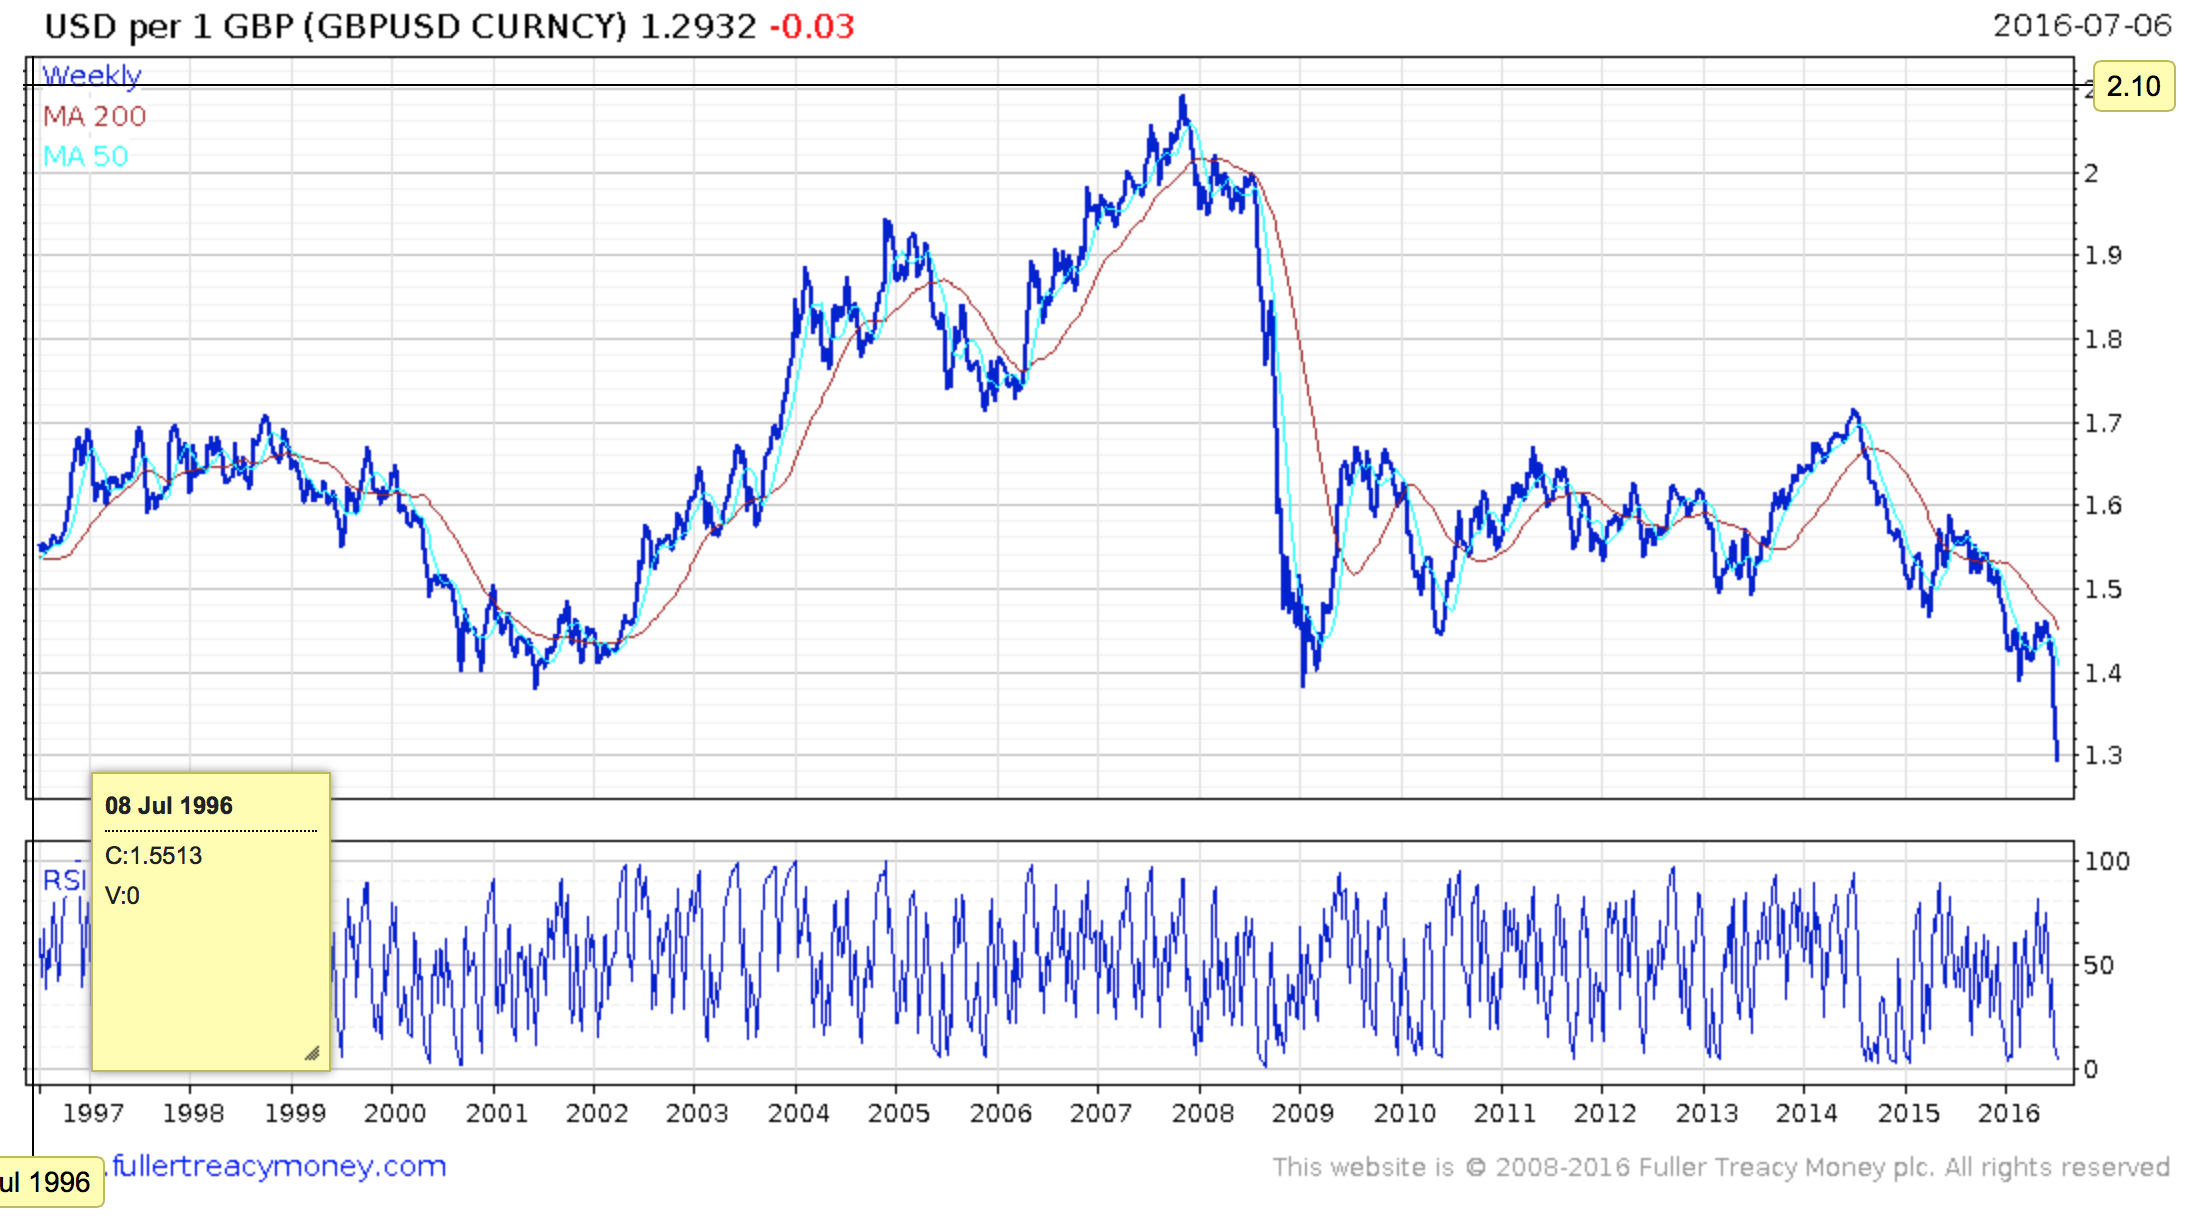
Sterling‘s decline has been the most obvious impact of the Brexit vote. Against the dollar, it has fallen to its lowest level since the 1980s, at the height of the miners’ strike. It is down 40% since its pre-crisis peak in 2007. Short term it now looks oversold, but it is impossible to rule out further declines, at least until there is some clarity on how and when negotiations for Brexit are likely to begin. But note that sterling has been in decline for more than two years, long before Brexit.
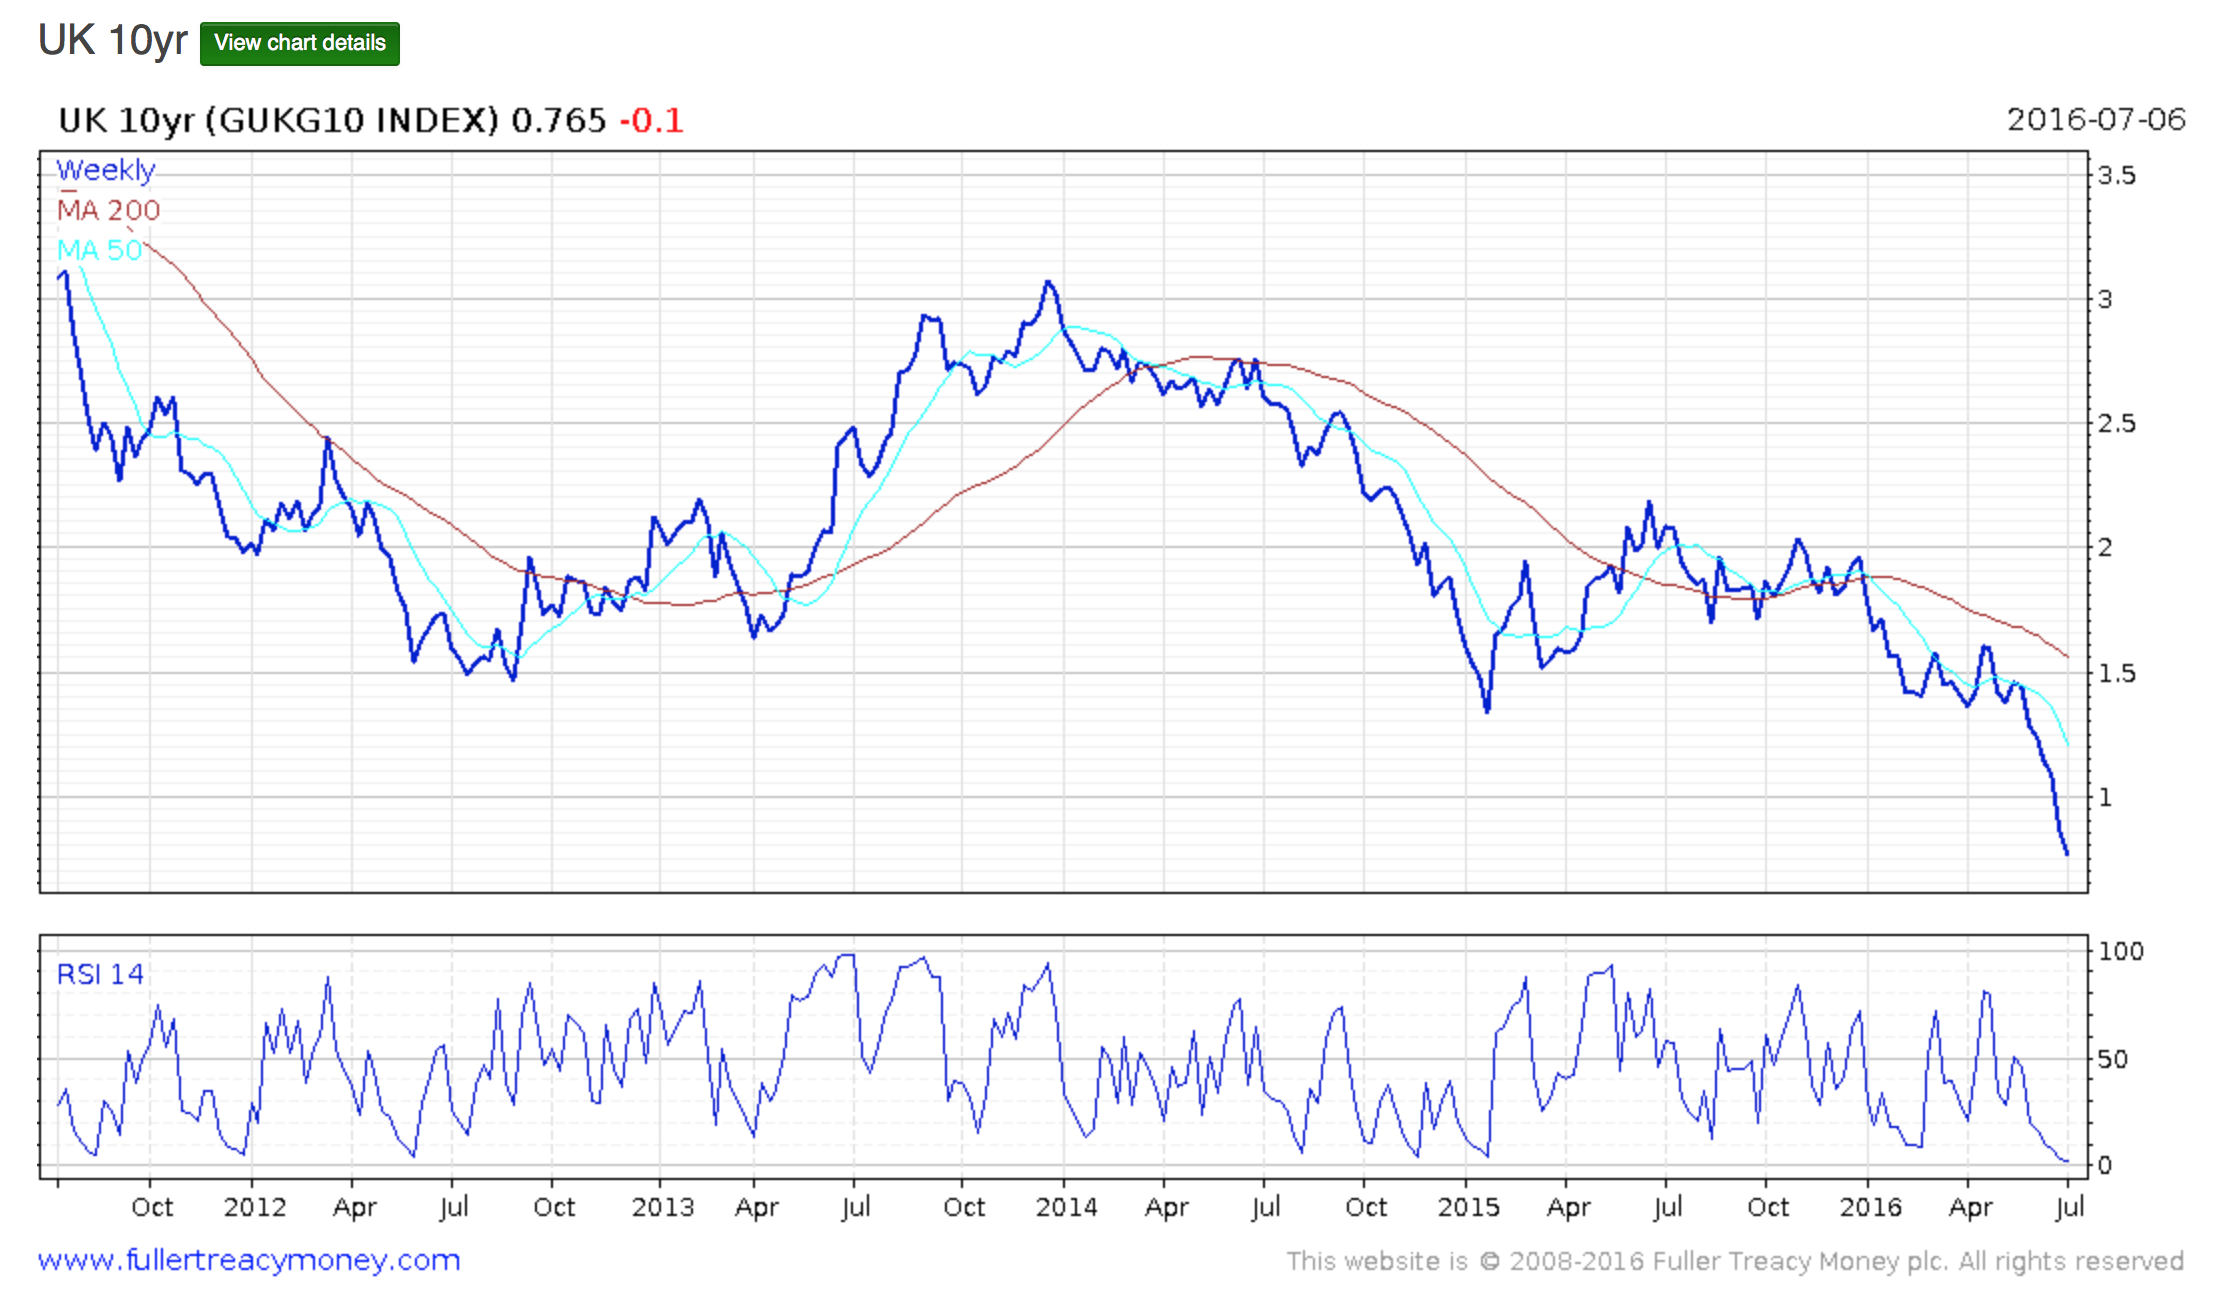
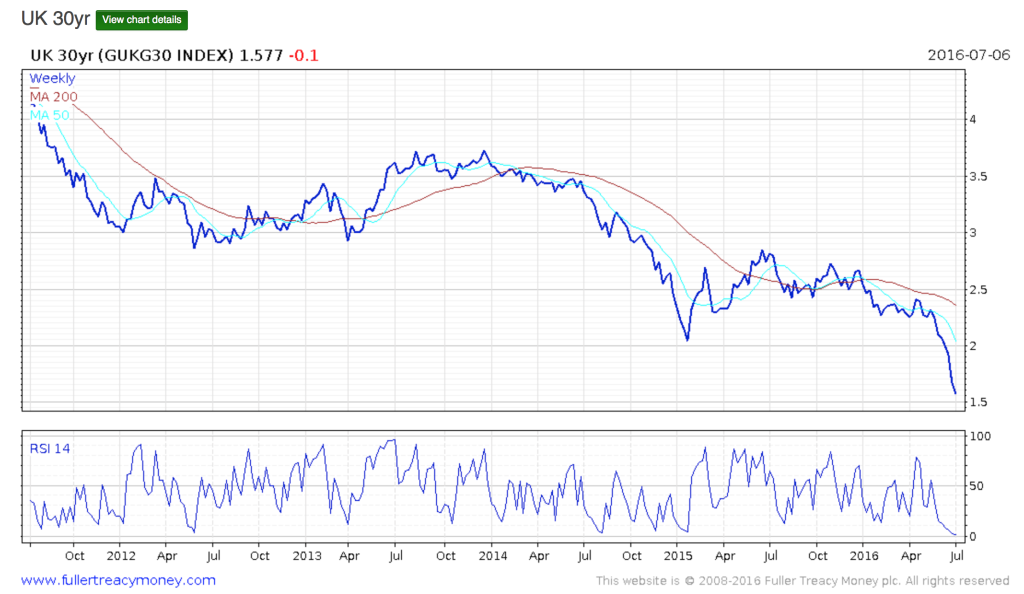
Bond yields have fallen together right along the yield curve. I show here both the 10-year and the 30-year yields on conventional gilts. Both are trading at all-time lows, though also appearing oversold on a short term basis. The yield curve remains upward sloping for now. An inverted yield curve, when longer term yields are lower than short term one, is a traditional warning of impending recession, but we are yet to see that materialise.
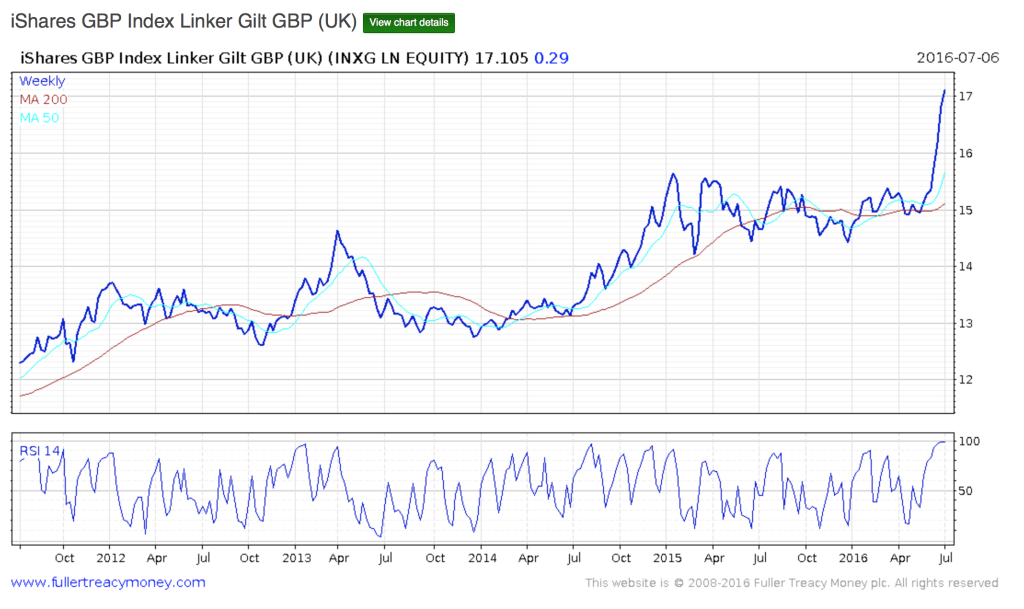
The fall in yields has produced some remarkable increases in gilt prices, particularly at the longer end of the curve (which is inherent in the structure of the market when yields are already ultra-low). It is important to remember that yields have been falling all round the world, with at least three countries (the latest being Switzerland) now able to sell 50-year bonds at negative interest rates – an unheard of phenomenon. There is no better indication of the fact that the world is trapped for now in a low growth, low interest rate, deflationary environment.

It is not just conventional index-linked gilts that have done well. Index-linked bonds, a core component in the Money Makers model portfolios, have also performed well. With inflation still at very low levels, real (inflation-adjusted) yields have also declined – another global phenomenon. That in turn has helped the price of gold, which normally does well when real yields are falling and is also benefiting from its traditional safe haven status. As geared plays on the price of precious metals, mining shares have more than doubled from their lows.

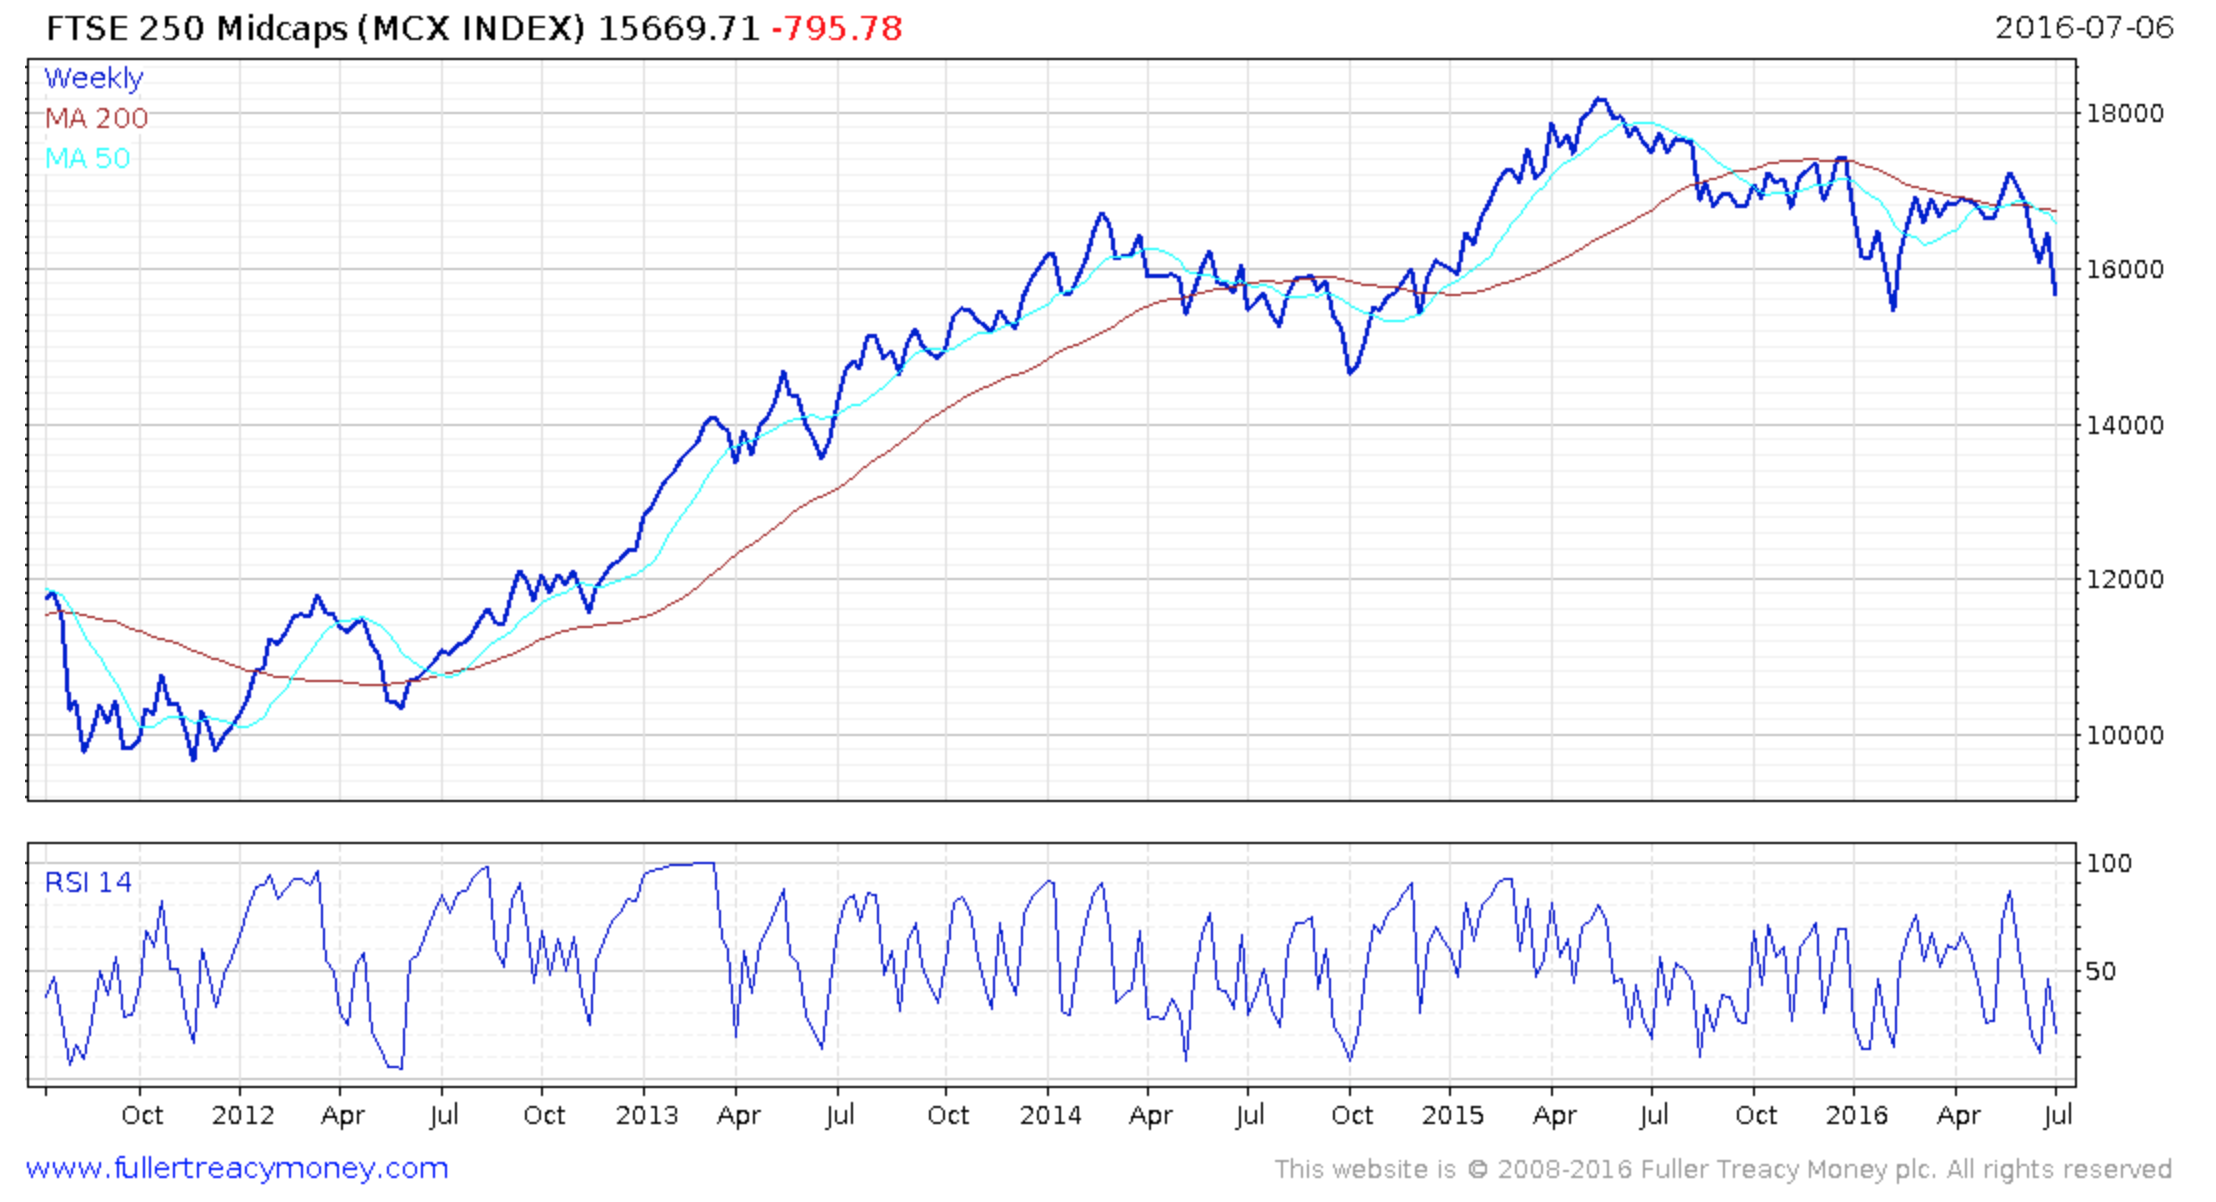
The contrasting fortunes of the FTSE-100 index (whose members derive 70% of revenues overseas and whose earnings are boosted by sterling’s decline) and the wider UK equity market (predominately opposed of domestic companies) has been marked since the referendum vote. Here are the Footsie and 250 indices over five years. The latter has fallen further in percentages terms than the former, which ironically, in the light of all the dire pre-vote warnings, is higher today than it was when the referendum campaign began, although still below its high around the end of Q1 2015. Both the FTSE 250 and most smaller cap indices had a long period of strength between 2012 and 2014. The recent setback needs to be seen in that longer term context.

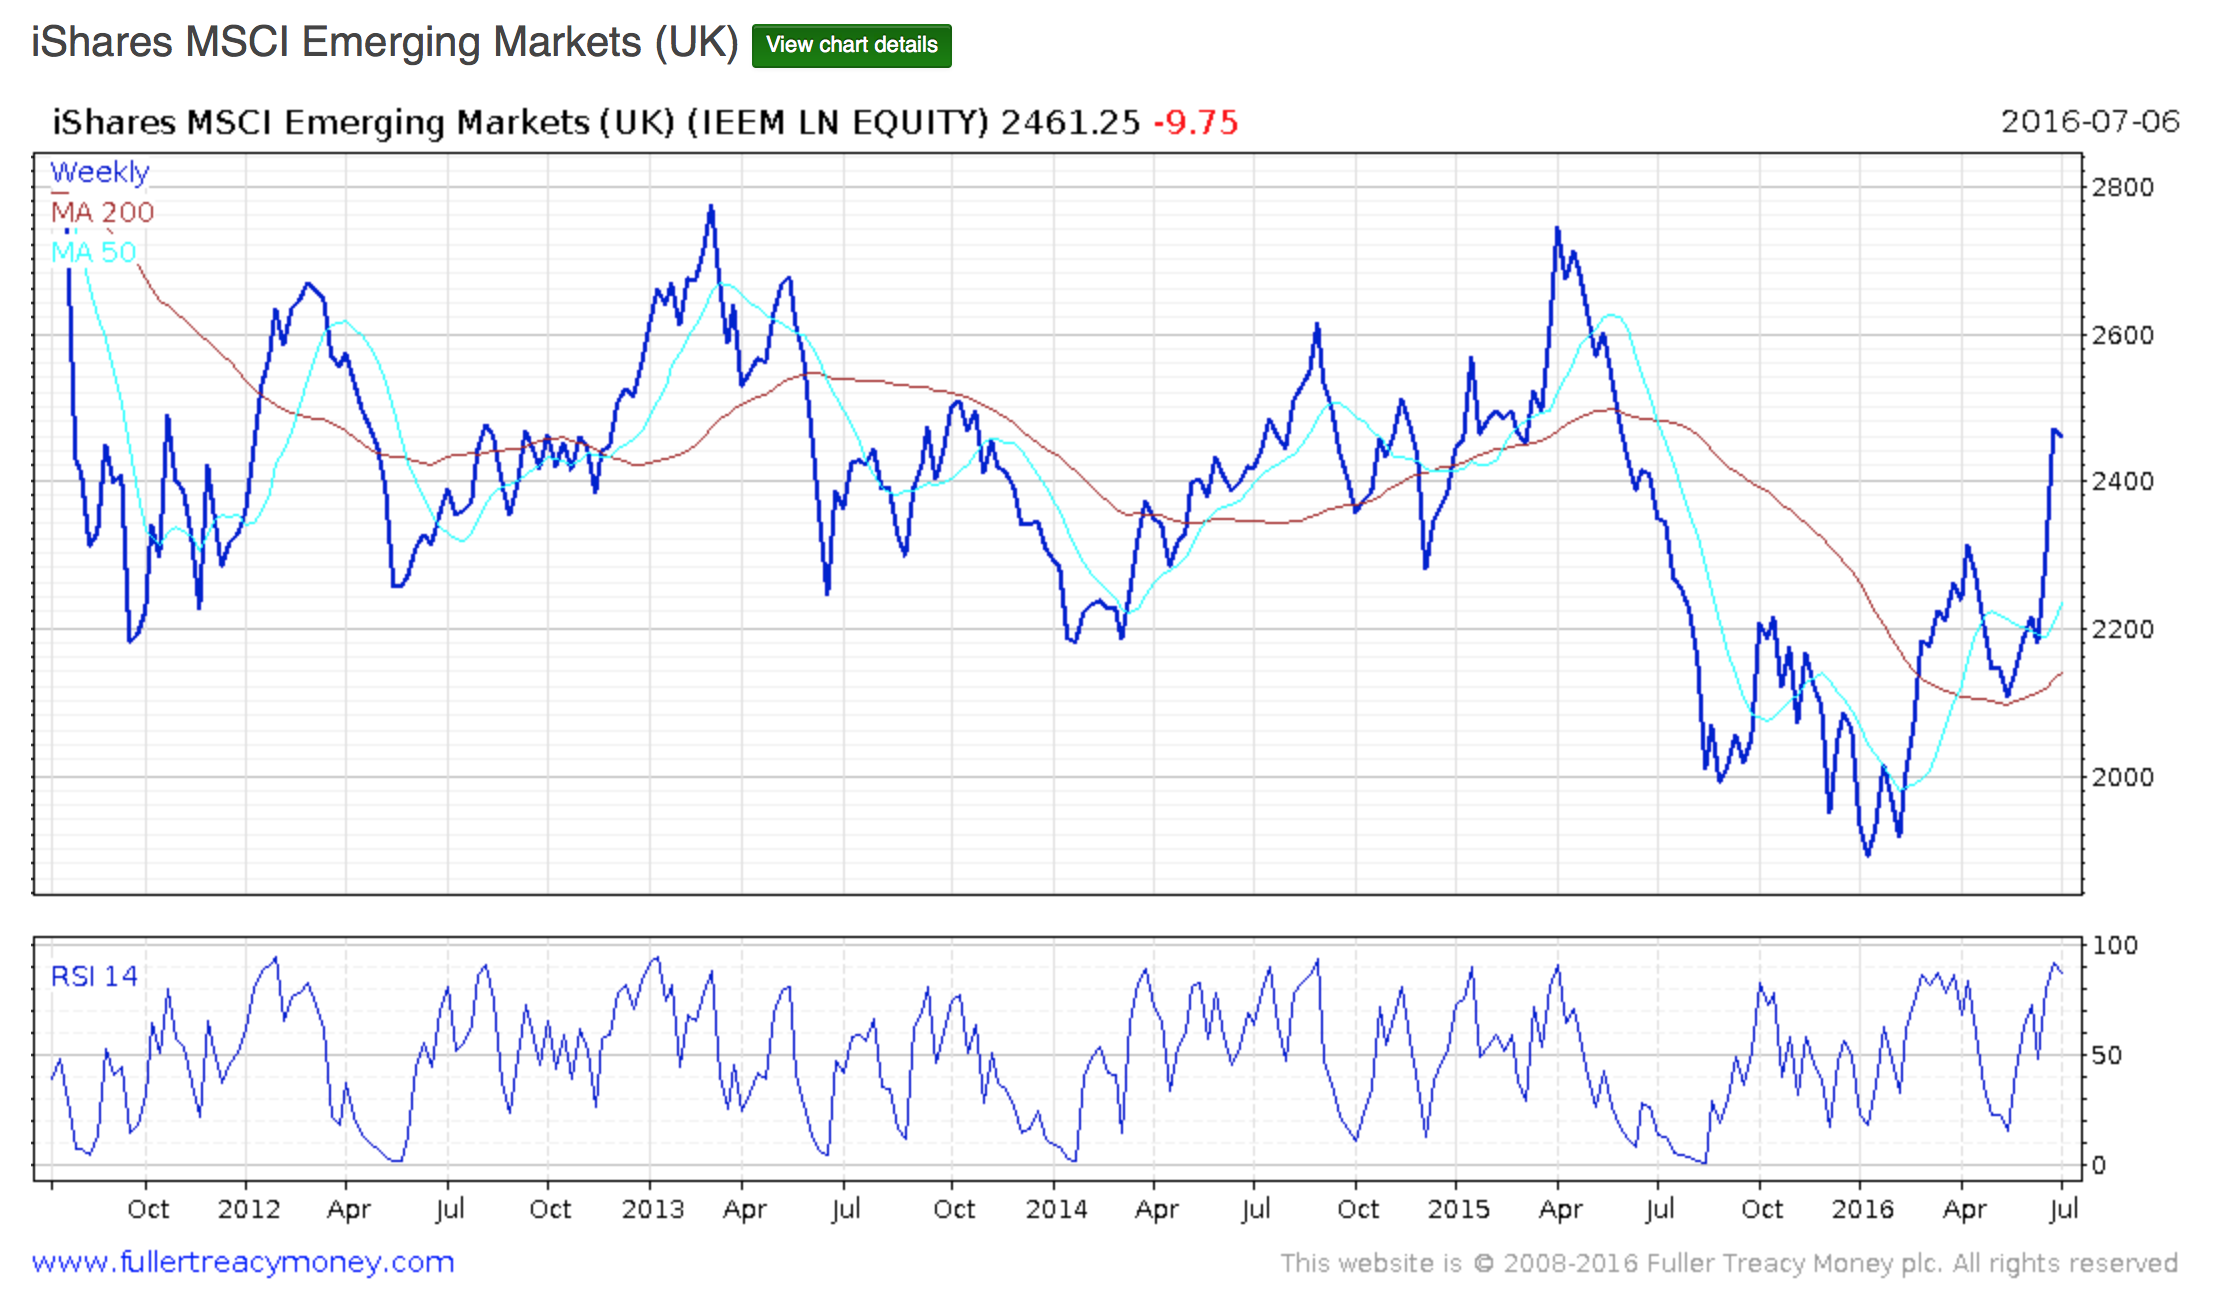
Looking further afield, the US equity market (S&P 500) has been trading sideways for some time, but until the Brexit vote was finally threatening to break out of its trading range to the upside. The economic data looks reasonable, despite one recent, possibly rogue, monthly jobless figure. Emerging markets, which have sold off sharply since 2012, have meanwhile recovered strongly, helped by the recovery in commodity prices and (for UK investors) the strength of sterling. I have added to my position in Murray International, the global investment trust, and one of the prime beneficiaries, more than once since the start of the year.


Volatility, although it spiked after the Brexit vote, has fallen back to a relatively low level, well below those seen during the global financial crisis in 200708 and the more recent eurozone crises.

Conclusion: almost all these charts, with the exception of the last, point to either short term oversold or overbought conditions, which is what typically happens when the markets react to a surprise event. It is reasonable to expect some retracement from here in both equity and bond markets, creating trading opportunities. Commodities and emerging markets look to be establishing significant rebounds, and are trading above their 200-day moving averages. However, given how many issues about Brexit remain to be resolved, the uncertainty is likely to put a brake on any sustained equity market recovery in the UK until the autumn. If as expected Theresa May wins the Tory leadership campaign, the risk of political instability and/or some form of constitutional crisis will be eliminated, at least for now.